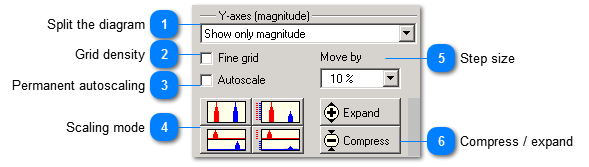
Split the diagram
VM-TRACK provides magnitude and phase. Both can be displayed in the measurement chart. You can select whether one of them is to be shown mainly (using more space) or only.
|
|
 Grid density
|
|
If you activate this checkbox, VM-TRACK will show grid lines at all graduation marks of the Y-axis.
| |
|
 Permanent autoscaling
|
|
If you activate this checkbox, VM-TRACK will rescale the Y-axes each time the measurement chart is refreshed, using the last scaling mode. | |
|
 Scaling mode
|
|
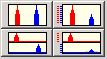
There are four scale modes:
-
All curves are maximized. -
Same scale for all curves. -
All curves are maximized and stacked with their own area. -
All curves use the same scale, they are stacked with their own area.
| |
|
 Step size
|
|
The step size (shown in scale lengths), by which measurement curves and scale are shifted during a movement. For instance, 10% means that the measurement curves are moved by 1/10 of the Y axis.
| |
|
 Compress / expand
|
|
These buttons expand or compress all measurement curves in Y direction.
| |
|
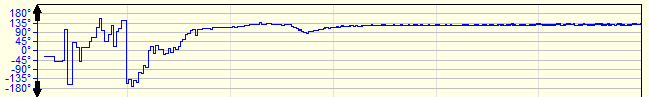
Adjusting the phase display
The phase display of the signal can be adjusted by right-clicking on the y-axis of the phase-speed diagram. Three display options are available:
|
|
|
Display of -180° to +180°. Phase values less than -180° resp. greater than +180° are drawn in the same diagram.
|
|
|
|
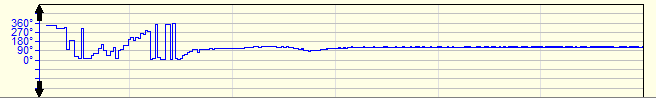
Display of 0° to 360°. Phase values less than 0° resp. greater than 360° are drawn in the same diagram.
|
|
|
|
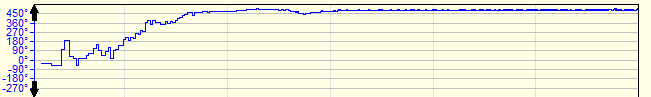
Ongoing scale. The scale expands to any size.
|