|
|
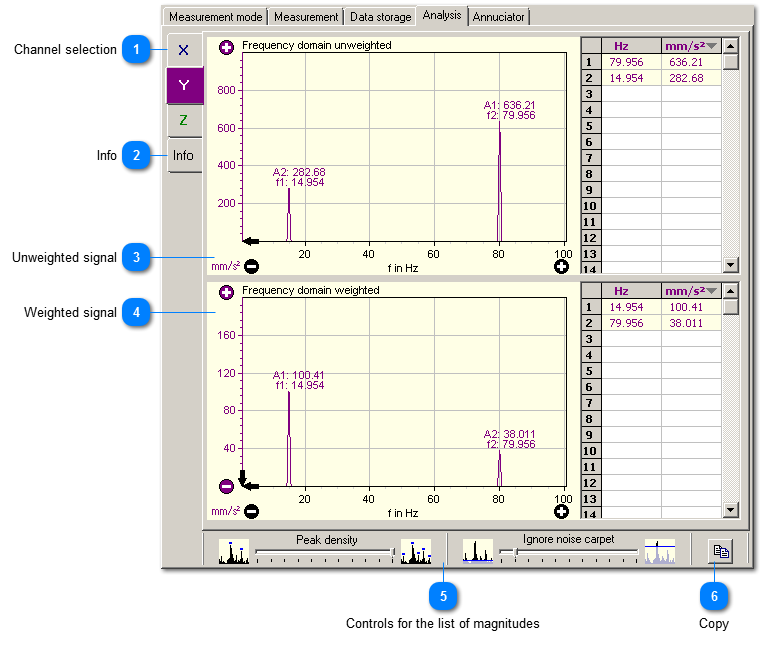
VM-SHIP+ allows a frequency analysis for both, the unweighted and weighted vibration signal. This way you can detect causes of too high vibration values.
 Channel selection
|
|
Graphical analysis is provided for each measuring channel.
| | |
 Info
 Information concerning the storage location of the measured data for analysis etc. | |
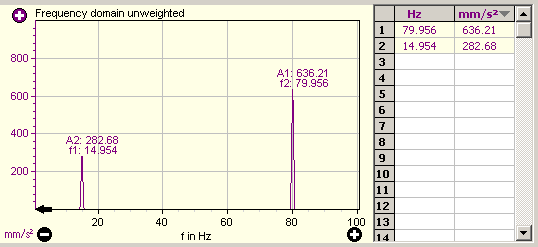
 Unweighted signal
The unweighted signal only contains the bandpass filter before it is transmitted to the frequency analysis. The displayed vibration frequencies do not have a special weighting with regard to health, comfort or perception of humans.
Scaling (spreading and compressing the measurement curve) is carried out by means of the buttons  and  . Scrolling is carried out by clicking on the scroll arrows.
Scaling with the mouse
By means of the mouse, the chart can be zoomed or scrolled on the frequency axis. The chart is scrolled with the left mouse button held down. By holding down the right mouse button, you choose an area to be zoomed.
List of magnitudes
The highest magnitudes are detected automatically and they are presented with frequency and value. Frequency and value are indicated directly in the chart as well as in the list next to the chart. The detection algorithm can be configured. | |
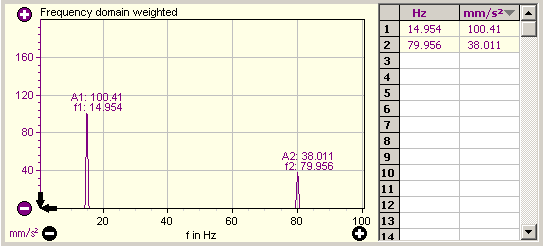
 Weighted signal
The weighted signal contains the bandpass filter and weighting filter for human vibration before it is transmitted to the frequency analysis. Thus, the displayed vibration frequencies are weighted with regard to comfort/health of humans.
Scaling (spreading and compressing the measurement curve) is carried out by means of the buttons and . Scrolling is carried out by clicking on the scroll arrows.
Scaling with the mouse
By means of the mouse, the chart can be zoomed or scrolled on the frequency axis. The chart is scrolled with the left mouse button held down. By holding down the right mouse button, you choose an area to be zoomed.
List of magnitudes
The highest magnitudes are detected automatically and they are presented with frequency and value. Frequency and value are indicated directly in the chart as well as in the list next to it to graphic. The detection algorithm can be configured. | |
 Controls for the list of magnitudes
These controls work like the ones in the VM-FFT. | |
 Copy
 By means of this button the graphical presentation of both signals is copied to the clipboard. Afterwards, the chart can be entered into a word processing or other programs.
| |
|
|