|
|
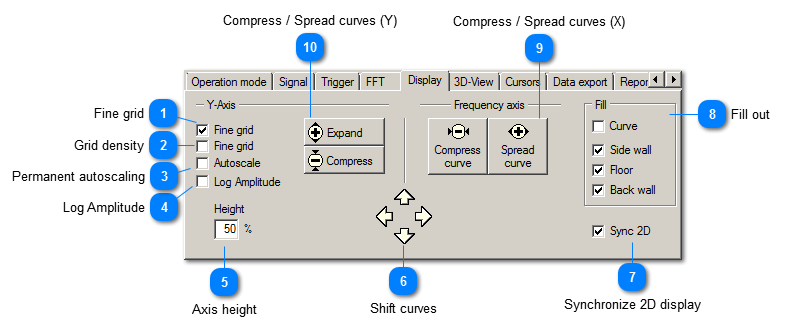
 Fine grid
|
|
Activates display of the grid.
| | |
 Grid density
|
|
Activates grid lines at all graduation marks of the Y axis.
| | |
 Permanent autoscaling
|
|
If activated, VM-FFT 3D will rescale Y axes each time the measurement chart is refreshed.
| | |
 Log Amplitude
|
|
Activates the logarithmic display of the y-axis.
| | |
 Axis height
|
|
The height of the diagram can be adjusted by entering values between 20% and 100%.
| | |
 Shift curves
|
|
Shifts all traces together into the desired direction.
| | |
 Synchronize 2D display
|
|
Activates synchronization with 2D display of the frequency analysis. Switch into 2D display by clicking on the button  . | | |
 Fill out
|
|
To improve visibility several elements of the measurement chart can be displayed filled. Curve, Side wall, Floor and Back wall can be seleceted.
| | |
 Compress / Spread curves (X)
|
|
Compresses or spreads the measurement curve in its frequency extension.
| | |
 Compress / Spread curves (Y)
|
|
Compresses or spreads the measurement curve of all traces in Y direction.
| | |
|
|