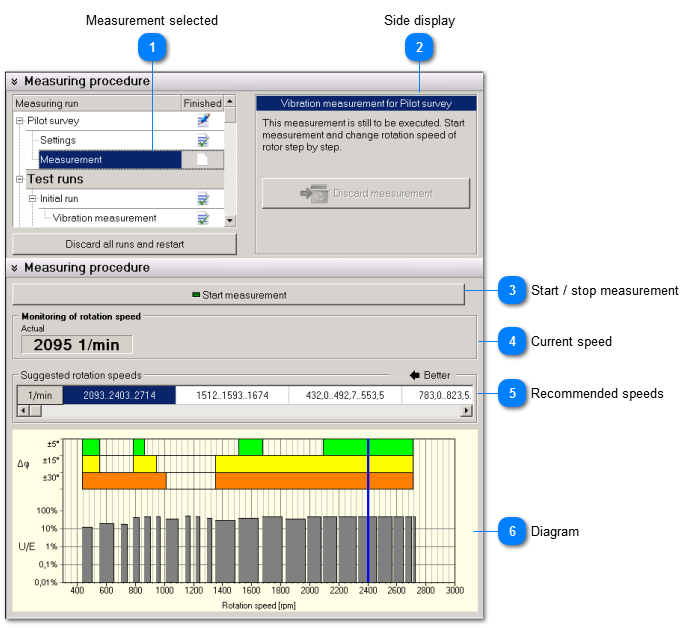
The results of pilot survey are displayed in a diagram versus the specified
speed range. Recommended speeds are indicated in a list.
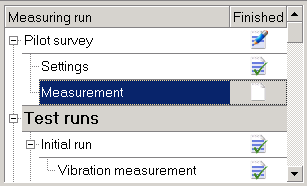
 Measurement selected
|
|
Select measurement as the next step after settings. | |
|
 Side display
This area is similar in all steps of measurement. A description can be found here. |
|
 Start / stop measurement
|
|
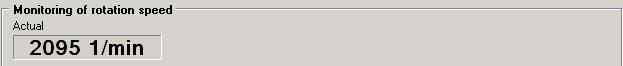
 Current speed
|
|
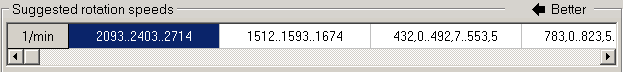
 Recommended speeds
This field shows recommended rotation speeds. The best values are found on the left side. Each entry has the form Min..Nominal..Max
The nominal value is in the middle between minimum and maximum. It should be used preferably.
|
|
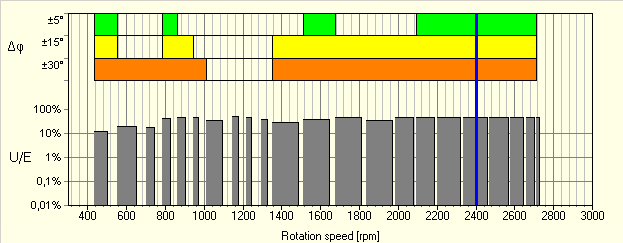
 Diagram
-
Angle stability: Resonances result in changeable phase angles. There are three colored bars for angle stability. The green bar indicates best values below +/- 5 %. -
Dominant unbalance signal: Unbalance vibration is only one component in a mix of other frequencies. The higher the difference between unbalance vibration and other vibration the better the chance of good balancing results. A value of 100 % in the U/E diagram would mean that there is no other signal than unbalance vibration.
|
|