|
|
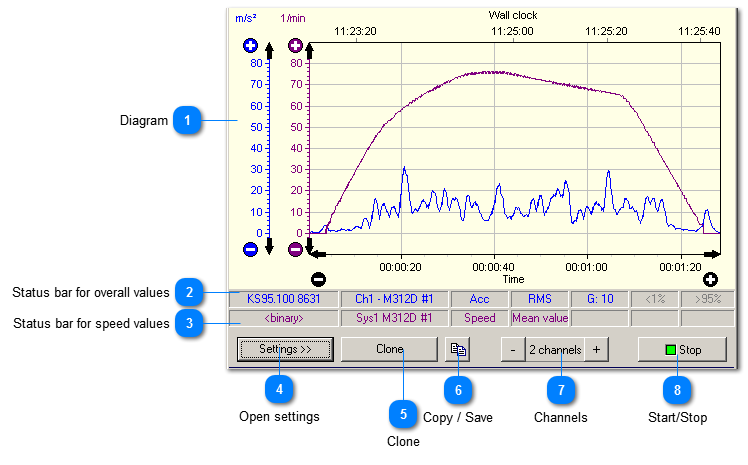
 Diagram
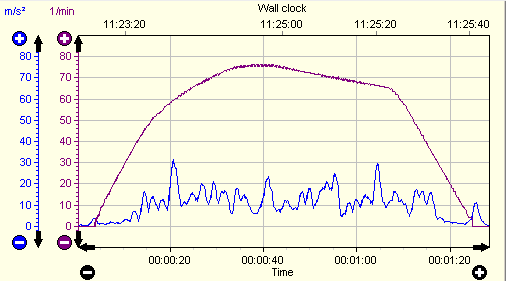
The diagram shows the measured characteristic versus time. Two time axes are drawn:
|
upper:
|
The clock time
|
|
lower:
|
The elapsed time since since start
| For each channel a curve is drawn in a different color. Each curve has its own y axis with individual scaling and zero shifting.
For changing the axis scaling the buttons  and  are used. Shifting can be done by clicking the arrows. Alternatively you may shift the axis with presses left mouse button and scale with right mouse button pressed.
| |
 Status bar for overall values
This status bar appears if you chose to measure overall values on the respective channel. It shows
| |
 Status bar for speed values
This status bar appears if you chose to measure speed values on the respective channel. It shows
-
<binary> in the sensor field to mark a frequency input
-
-
-
| |
 Open settings
|
|
Opens and closes the setup menu.
| | |
 Clone
|
|
Opens a new window with the same settings which can be modified.
| | |
 Copy / Save
|
|
Copies the diagram data into the clipboard or saves it on hard disk. Different file formats can be chosen.
| | |
 Channels
|
|
Increase or decrease the number of measuring channels (and curves). One to four channels are possible.
| | |
 Start/Stop
|
|
Starts and stops measurement.
| | |
|
|