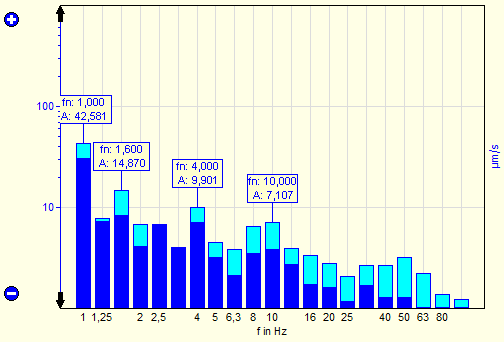
With activated amplitude list function VM-OCT measures the maximum amplitudes and charts them. They can also be shown in the diagram if desired.
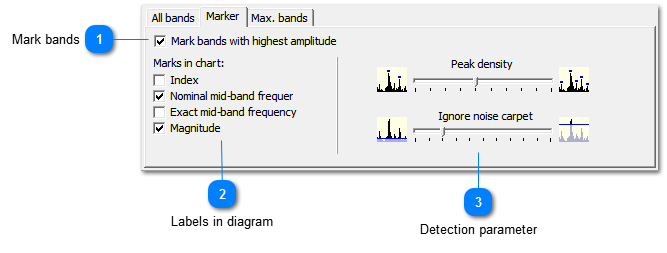
 Mark bands
Activates the function.
|
|
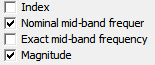
 Labels in diagramShows markers at the found amplitudes in the diagram. VM-OCT can display an index, nominal or exact mid-band frequency and amplitude.
|
|
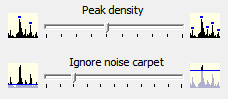
 Detection parameter
Specifies the mode of searching maximum amplitudes.
-
Peak density selects the number amplitudes to be found. Shift the slider to the right to show more values.
-
Ignore carpet determines a minimum level for amplitude detection. Values below are ignored. Shift the slider to the right to increase the threshold.
|
|