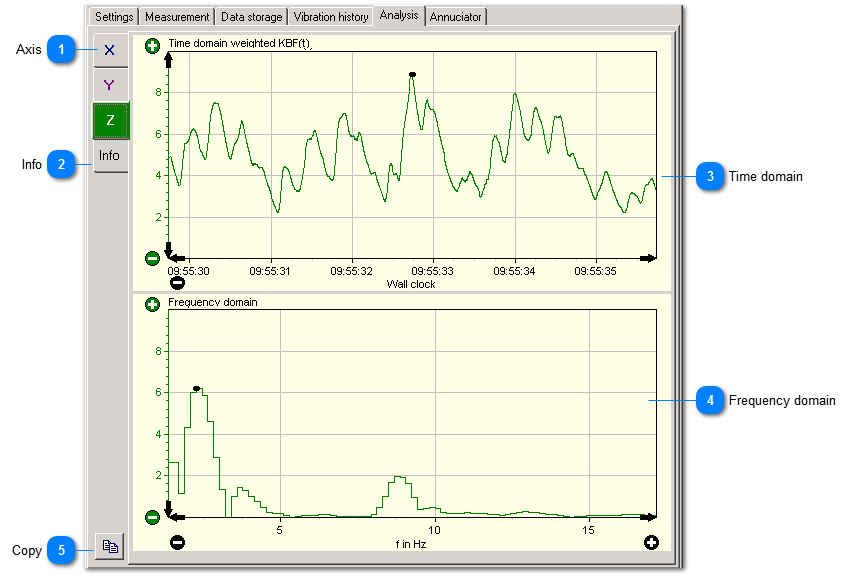
If you select an event in the
data storage VM-PERS+ can perform an analysis provided that
time signal recording was enabled.
 Axis
|
|
There is an analysis for each axis direction. The first shown analysis always belongs to the direction with the most critical magnitude.
| |
|
 Info
 Information concerning the file location. |
|
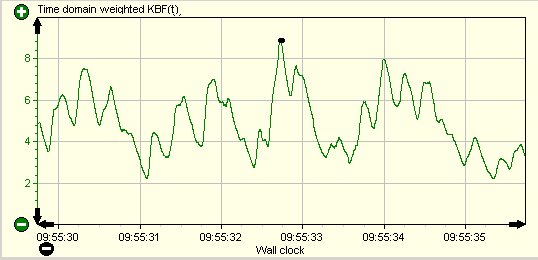
 Time domain
Band filtered weighted vibration velocity KBF(t) in time domain. The peak magnitude is marked.
|
|
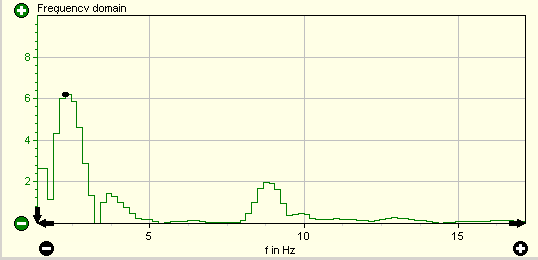
 Frequency domain
Band filtered weighted vibration velocity KBF(t) in frequency domain. The peak magnitude is marked.
|
|
 Copy
Copies the analysis data to the clipboard for use in reports.
|
|