|
|
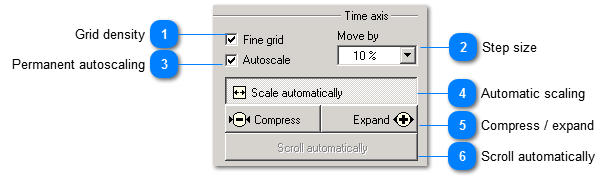
 Grid density
|
|
If you activate this checkbox, VM-PLOT will show grid lines at all graduation marks of the Y axis.
| | |
 Step size
|
|
The step size (shown in scale lengths) by which measurement curves and scale are shifted during a movement. For instance, 10% means that the measurement curves are moved by 1/10 of the frequency axis.
| | |
 Permanent autoscaling
|
|
Scales the trace always in a way that always the complete measuring time will be visible.
| | |
 Automatic scaling
|
|
Scales the trace once in a way that the complete measuring time is visible.
| | |
 Compress / expand
|
|
These buttons expand or compress all measurement curves in time direction.
| | |
 Scroll automatically
|
|
Shifts the curve left if it reaches the right edge so that always the current value will be shown.
| | |
|
|