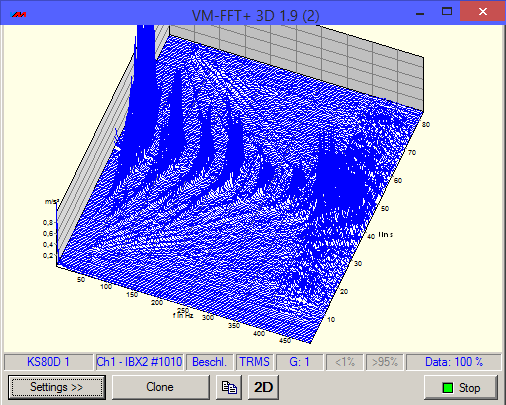
When performing a frequency analysis, only the current FFT is displayed. Information of previous analyses disappear from the desktop. With VM-FFT 3D a number of frequency analyses can be displayed simultaneously. This kind of presentation is often called "waterfall diagram". Especially with run up/coast down measurements critical frequencies can be identified at a glance in VM-FFT 3D.
Apart from 3D display, VM-FFT 3D offers also a 2D display. Thus, one can switch smoothly to the display of the frequency spectrum any time. Thereby, many analysis options of the
VM-FFT are available. The 3D display can be turned, shifted and zoomed in space. Even small structures can be viewed from different perspectives.
Apart from frequency analyses (manual settings), bearing diagnoses can be performed and spectra of acoustic values can be displayed with VM-FFT 3D. It can always be chosen between waterfall diagram (3D) and frequency spectrum (2D).