|
|
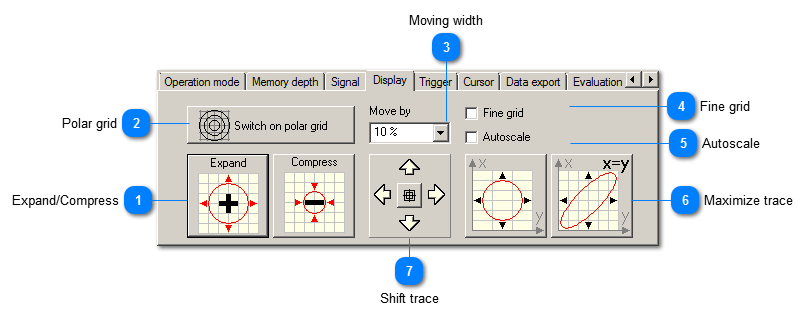
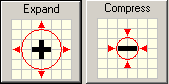
Display of traces - Orbit Expand/Compress
|
|
Expands or compresses the trace in X and Y direction.
| | |
 Polar grid
|
|
Switches on the polar grid in the background of the trace.
| | |
 Moving width
|
|
The increment, expressed in scale length, by which the measurement curve and thus the scale is pushed further during a moving operation. For example, 10% corresponds to a movement of measurement curves around 1/10th of the X or Y axis.
| | |
 Fine grid
|
|
Draws gridlines at all scale lines of the y-axis.
| | |
 Autoscale
|
|
Scales the Y axis at each update of the measured value graphic.
| | |
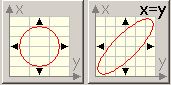
 Maximize trace
|
|
The left button maximizes the curve. The right button maximizes the curve on the same scaling.
| | |
 Shift trace
|
|
The control pad shifts the measurement curve in the equivalent direction. By pressing the button in the center the curve is center-aligned horizontally and vertically.
| | |
|
|