|
|
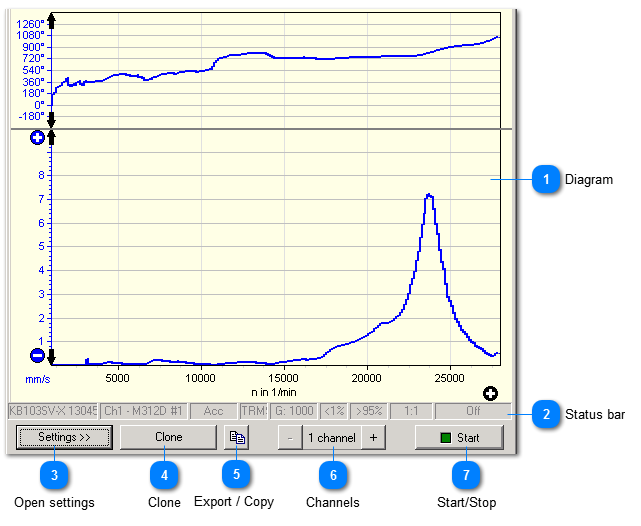
 Diagram
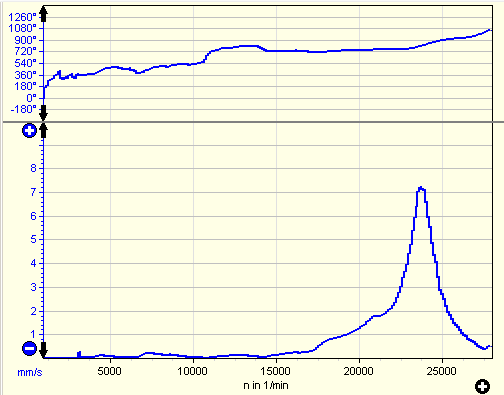
The curves show magnitude and phase of the vibration signal versus rotation speed or multiples of rotation speed. Each curve has its own y-axis which can be scaled and scrolled independently.
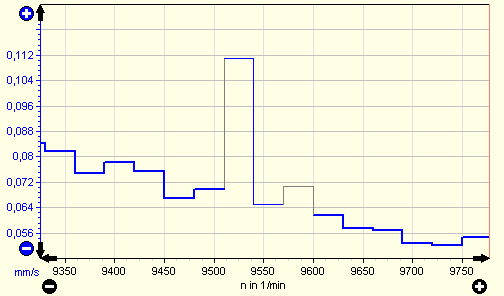
Scaling (spreading and compressing the measurement curve) is carried out by means of the buttons  and  . Scrolling is carried out by clicking on the scroll arrows. The display control panel contains more settings for the measurement chart. By means of the mouse, the measurement chart can be zoomed or scrolled on the frequency axis. The chart is scrolled with the left mouse button held down. By holding down the right mouse button, you choose an area to be zoomed.
| |
 Status bar
Shows the most important settings of the channel:
| |
 Open settings
|
|
Opens and closes the setup menu.
| | |
 Clone
|
|
Opens a new window with the same settings which can be modified.
| | |
 Export / Copy
|
|
Copies the diagram data into the clipboard or saves it on hard disk. Different file formats can be chosen.
| | |
 Channels
|
|
Increase or decrease the number of measuring channels (and curves). One to four channels are possible.
| | |
 Start/Stop
|
|
Starts and stops measurement.
| | |
|
|