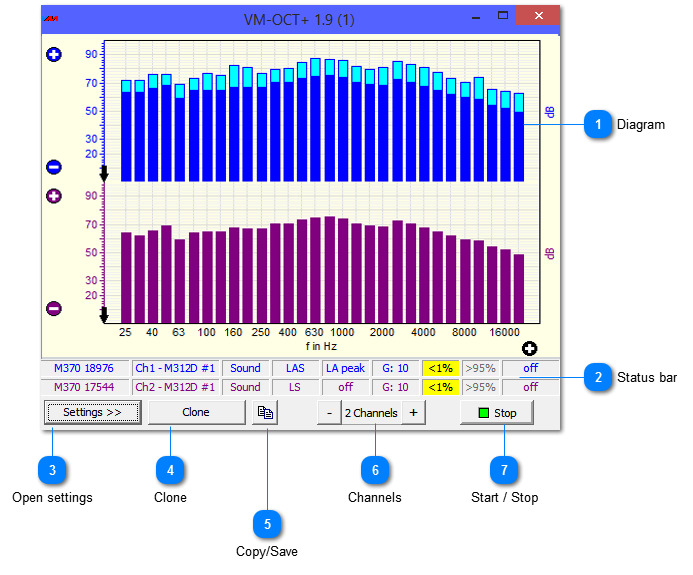
The compact view of VM-OCT shows the octave band analysis including the most important status indicators.
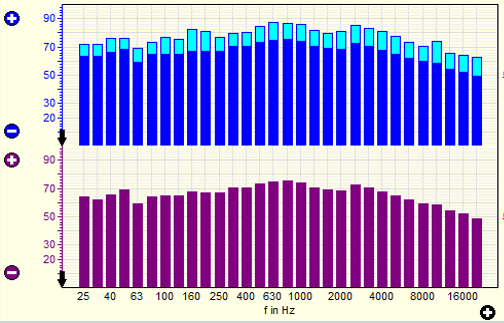
 DiagramThe graphics shows the octave bands and their amplitudes. Each channel is shown in a separate diagram with individual scaling options.
Scaling can be done by clicking the  and  buttons. For shifting click the axis arrows. The setup panel includes more options for changing the graphics.
Scaling with the mouse
The graphics can be shifted and zoomed along the frequency axis by mouse operation. Pressed left mouse button shifts and right mouse button zooms the diagram.
|
|
 Status bar
The status bar shows the following channel settings and indicators:
|
|
 Open settings
|
|
Opens and closes the setup menu.
|
|
|
 Clone
|
|
Opens a new VM-OCT window with the same settings which can be modified.
|
|
|
 Copy/Save
|
|
Copies the diagram data into the clipboard or saves it on hard disk. Different file formats can be chosen.
|
|
|
 Channels
|
|
Increase or decrease the number of measuring channels (and curves). One to four channels are possible.
|
|
|
 Start / Stop
|
|
Start Starts and stops the measurement
|
|
|