|
|
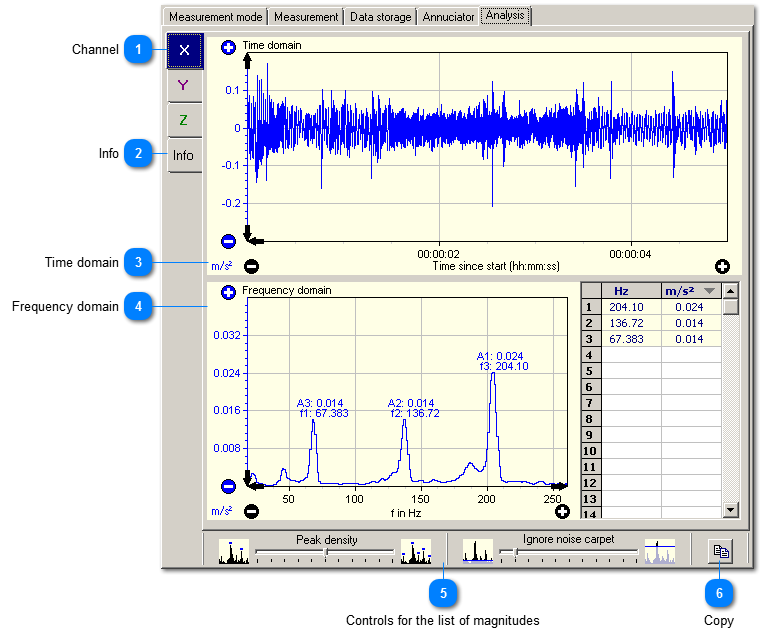
VM-WIND+ offers an analysis of vibration signals in time and frequency domain: Beyond the measurements required by VDI 3834 you identify first causes for elevated vibration total values.
For deeper analysis, further specialized software modules are available, e.g.
If vibrations are caused by an unbalance, use the VM-BAL to balance the rotating component.
 Channel
|
|
Graphical analysis is provided for each measuring channel.
| | |
 Info
 Information concerning the storage location of the measured data for analysis etc. | |
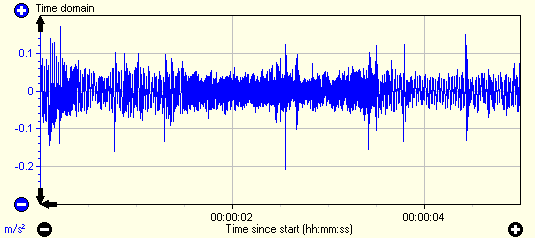
 Time domain
The analysis in time domain shows e.g. whether the values vary a lot during the measurement or whether the signal contains shocks.
Scaling (spreading and compressing the measurement curve) is carried out by means of the buttons  and  . Scrolling is carried out by clicking on the scroll arrows.
Scaling with the mouse
By means of the mouse, the chart can be zoomed or scrolled on the time axis. The chart is scrolled with the left mouse button held down. By holding down the right mouse button, you choose an area to be zoomed.
| |
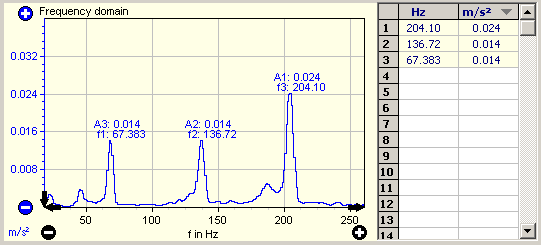
 Frequency domain
Rotor frequency, generator frequency, natural frequency... By means of the frequency analysis you can identify the components which are mainly responsible for the vibration total value.
Scaling (spreading and compressing the measurement curve) is carried out by means of the buttons and . Scrolling is carried out by clicking on the scroll arrows.
Scaling with the mouse
By means of the mouse, the chart can be zoomed or scrolled on the frequency axis. The chart is scrolled with the left mouse button held down. By holding down the right mouse button, you choose an area to be zoomed.
List of magnitudes
The highest magnitudes are detected automatically and they are presented with frequency and value. Frequency and value are indicated directly in the chart as well as in the list next to it to graphic. The detection algorithm can be configured.
| |
 Controls for the list of magnitudes
These controls work like the ones in the VM-FFT. | |
 Copy
 By means of this button the graphical presentation of both signals is copied to the clipboard. Afterwards, the chart can be entered into a word processing or other programs.
| |
|
|