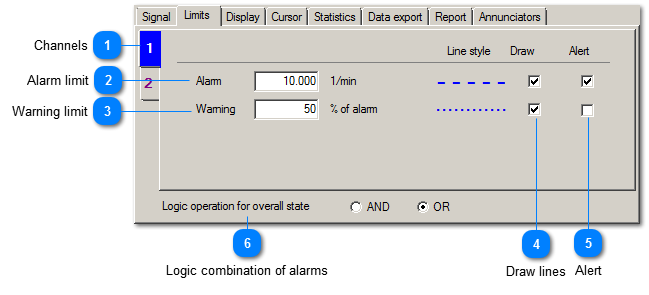
The measurand can be compared with warning and alarm limits. These limits can be displayed as lines in the diagram.
 Channels
|
|
All settings can be entered independently for each channel. The number of tabs depends on the number of active channels.
| |
|
 Alarm limit
|
|
The alarm limit is entered in measuring units according to the channel settings.
| |
|
 Warning limit
|
|
The warning limit is entered in percent of the alarm limit.
| |
|
 Draw lines
|
|
If the checkboxes are activated the alarm limits will be drawn as lines in the diagram.
| |
|
 Alert
|
|
When the measuring signal crosses a limit line VM-PLOT can perform the following actions:
-
Saving the measured data on disk -
controlling external alarm devices
| |
|
 Logic combination of alarms
Each channel may have the following conditions:
-
-
above warning limit: Warning -
These channel status conditions can be combined to an overall status (channel O) by means of logic operations.
|
|