|
|
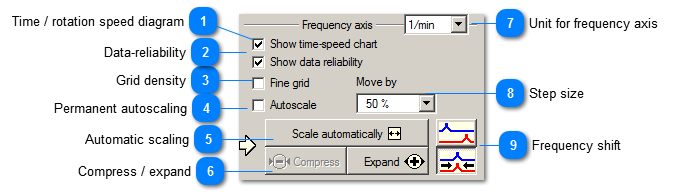
 Time / rotation speed diagram
Switches on the display of a time / speed diagram. Switching it off allows a bigger area for the magnitude / phase diagram.
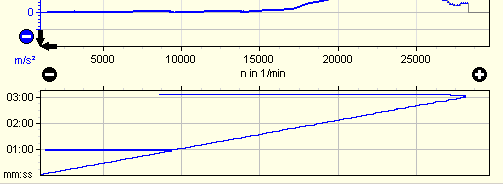
Example: The speed diagram shows a speed up measurement with a short drive interruption at 9600 1/min after 1 hour.
| |
 Data-reliability
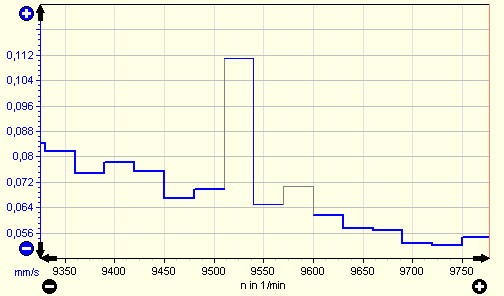
Different types of traces inform you about the reliability of the measured values. Each trace is divided into several rotation speed sections. Revolutions belonging to the same rotation speed are averaged.
|
• Grey line
|
0 ..1 revolution measured in this section, less reliable
|
|
• Thin line in channel color
|
2..9 revolutions measured in this section, acceptable reliability
|
|
• Bold line in channel color
|
10 or more revolutions measured in this section, good reliability
|
| |
 Grid density
|
|
If you activate this checkbox, VM-TRACK will show grid lines at all graduation marks of the frequency axis.
| | |
 Permanent autoscaling
|
|
The frequency axis is permanently adapted so that all lines with more than 5 % of the highest magnitude are visible.
| | |
 Automatic scaling
|
|
Automatically scales the frequency axis.
| | |
 Compress / expand
|
|
These buttons compress or expand the measurement curve.
| | |
 Unit for frequency axis
|
|
Switch between Hz and 1/min.
| | |
 Step size
|
|
The step size (shown in scale lengths) by which measurement curves and scale are shifted during a movement. For instance, 10% means that the measurement curves are moved by 1/10 of the frequency axis.
| | |
 Frequency shift
If in order analysis mode different orders are examined you can choose here how the frequency axis as scaled:
|
|
Measurements are displayed at their actual frequencies. This will help you to detect resonance frequencies.
|
|
|
Measurements are scaled to order 1, i.e. rotation frequency. The diagram will show you the reaction of the test object in different orders at the same speed.
| | |
|
|