|
|
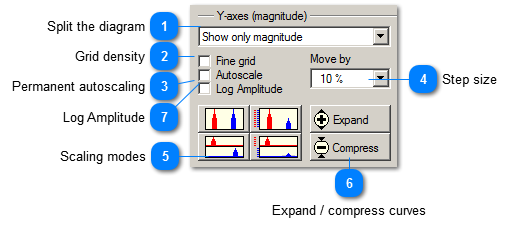
 Split the diagram
In principle, an FFT provides magnitude and phase. Both can be displayed in the measurement chart. You can select whether one of them is to be shown mainly (using more space) or only.
In some FFT or statistics modes, phase values do not have any technical significance. In this case, only magnitudes will be displayed. | |
 Grid density
|
|
If you activate this checkbox, VM-FFT will show grid lines at all graduation marks of the Y-axis.
| | |
 Permanent autoscaling
|
|
If you activate this checkbox, VM-FFT will rescale the Y-axes each time the measurement chart is refreshed, using the last scaling mode. | | |
 Step size
|
|
The step size (shown in scale lengths), by which measurement curves and scale are shifted during a movement. For instance, 10% means that the measurement curves are moved by 1/10 of the Y-axis.
| | |
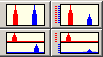
 Scaling modes
|
|
There are four scale modes:
-
All curves are maximized. -
Same scale for all curves. -
All curves are maximized and stacked with their own area. -
All curves use the same scale, they are stacked with their own area.
| | |
 Expand / compress curves
|
|
These buttons expand or compress all measurement curves in Y direction.
| | |
 Log Amplitude
Activates the logarithmic display of the y-axis.
| |
|
|