|
|
The Navigator provides a preview of the saved raw data and notes. Furthermore, diverse display and export functions are available.
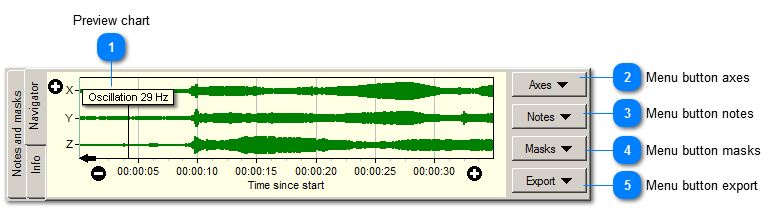
 Preview chart
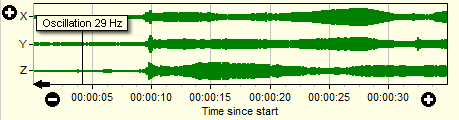
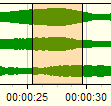
The recorded raw data is visible in the preview chart. It is displayed as level of the measuring channel for the whole measurement range and also includes the gain ranges of the different parts of the measurement range.
Time axis
By clicking right on the time axis you can switch between
-
the relative time since starting the measurement and -
absolute time of day (of the measurement PC) during measurement.
By means of the  button you expand the raw data, by means of the  button you compress it. By means of the the scroll arrows you shift the raw data in the respective direction.
Scaling with the mouse
By means of the mouse, the measurement chart can be zoomed or scrolled. The chart is scrolled with the left mouse button held down. By holding down the right mouse button, you choose an area to be zoomed.
Notes
|
|
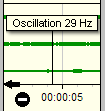
Notes are shown with a line that connects them to their exact time of recording on the time axis. Setting options for notes can be found in the Notes menu.
|
|
|
The cursor is shown as vertical line at the position of play-back. You can move it by mouse after you paused play-back. As moving the cursor interrupts the time consistence of the raw data signal, the instruments are resetted after cursor movement.
|
| |
 Menu button axes
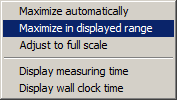
Pushing this button opens a menu. The axes menu provides functions for the channel axis and for the time axis.
|
Maximize automatically
|
If this entry is active, the maximum level in the displayed time range is drawn with maximum height. The other level values are scaled accordingly. At the same time, the entries for manual adjustments are deactivated. They are available again after deactivating "Maximize automatically".
|
|
Maximize in displayed range
|
Activating this entry causes the same behavior as automatic maximizing. But if you change the displayed time range, scaling is kept and not changed. If there are higher levels in the new time range, they are cut off in their height.
|
|
Adjust to full scale
|
The levels are scaled to the full dynamic range of the measuring equipment (M302 / M312).
|
|
Display measuring time
|
The relative time since starting the measurement file is displayed on the time axis when activating this entry.
|
|
Display wall clock time
|
The wall clock time valid during the original measurement is displayed on the time axis when activating this entry. If the time range is longer than 24 hours, the date is displayed as well.
| | |
 Menu button notes
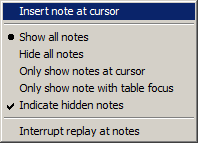
Pushing this button opens a menu. This menu controls the display of notes saved in the data stream.
|
Insert note at cursor
|
In addition to notes that were entered during the measurement, you can also add notes during offline-analysis by means of this function. It is only available if the cursor is not positioned at the beginning of the time axis, i.e. time display does not show 00:00:00 000. Activating this function causes a switch to the control panel Notes and masks and adds a new row to the table at the correct time position. The time marker is filled automatically and a default text for the note is given. You can change this text. |
|
Show all notes
|
If you select this option, the Navigator displays all notes in maximum presentable length. This function is useful if there are only few notes in the displayed time range.
|
|
Hide all notes
|
No notes are displayed if you select this option. Thus you have a clear view on other elements of the preview chart. |
|
Only show notes at cursor
|
The note closest to the cursor is displayed in full length.
|
|
Only show note with table focus
|
The Navigator displays the note you selected in the control panel Notes and masks.
|
|
Indicate hidden notes
|
Notes are displayed as running numbers, not as text. If Only show notes at cursor is active at the same time, only the note closest to the cursor is displayed in full length and all other notes are displayed with running numbers.
|
|
Interrupt replay at notes
|
If the cursor reaches a note during play-back, the Navigator automatically switches to pause mode and play-back is interrupted.
| | |
 Menu button masks
The masking technology of VibroMetra Offline allows to suppress measurement data (section by section) while it is transmitted to the instruments. This function may be helpful if there are short sections of measurement data which are not representative for the complete measurement course.
For instance there may be measurements which are to form characteristics for a longer time. If there are abnormal short-time events now, for example overload of a measurement channel because of accidentally vibrations on the sensor, the whole measurement would have to be dismissed. By masking the abnormal time period, the measurement is still valid. This procedure saves time and costs since the measurement does not need to be dismissed and carried out again. Another advantage of using masks is the preservation of the original measurement data. When the mask is deleted, the complete measurement data is visible again.
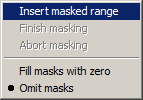
Insert masked range
|
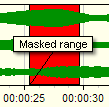
This function enters a mask visible in the Navigator graphic. This provisional mask is displayed in pale red first and can be
adjusted now. Therefore, the mouse pointer is positioned on one of the mask's side borders. By clicking left and dragging, the border can be adjusted anew.
|
|
If the mask is situated and sized correctly, the procedure is finished by the menu entry Finish masking. This entry is only active while a mask is inserted. After finishing, the mask is displayed in red. Additionally, an entry is created in the control panel Notes and masks. Here you can describe for which reason the mask was entered so that this information is available later. |
| If inserting a mask is to be aborted, the entry Abort masking has to be selected. The pale red mask disappears then. The entry is only active while a mask is inserted, too.
Fill masks with zero
This option causes the measuring time to run normally during the masked time period, but as signal, zeros are transmitted instead of the original measurement signal.
Omit masks
This option means that masked time periods are simply skipped. So regular measurement data is transmitted to the instruments until the masks starts and afterwards the measurement data following the mask is transmitted immediately.
| |
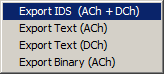
 Menu button export
The export functions allow to save measurement data from the currently displayed time period in a new file. This way, interesting sequences in the measurement data can be extracted and saved in smaller files. These files can be send by e-mail.
Different output formats are available. Text and binary export are only possible if you purchased licenses for these options.
|
IDS (ACh + DCh)
|
This option exports data in IDS format. This format is the VibroMetra format so that all additional pieces of information like wall clock time, notes, masks, etc. are saved as well. VibroMetra exports the signals of the measuring channels (ACh) as well as the rotation speed signal (DCh).
|
|
Text (ACh)
|
This option exports the signals of the measuring channels (ACh) into a text file. The data from all channels for the same time period is shown in one row separated by tabulators. The first column shows the time axis is seconds.
|
|
Text (DCh)
|
This option exports the rotation speed signal (DCh) into a text file.
|
|
Binary (ACh)
|
This option exports the signals of the measuring channels (ACh) into a file in binary format.
At first, a header in text format is written with two rows for the name of the measuring channels and the unit. Its followed by time and measurement data for each time period:
For each time period, the time of the measurement in seconds is written in double format (floating point number, 8 Byte), followed by the measured values of all channels in float format (floating point number, 4 Byte). In this order, the data of the time range shown in the preview chart follows time period per time period. |
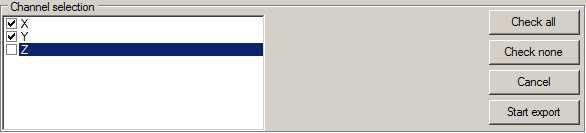
After having selected the format, you decide which channels are to be exported. You can deselect unimportant channels to reduce the amount of data.
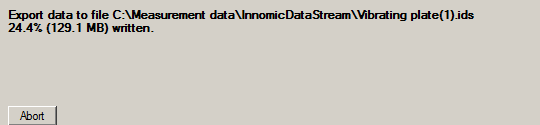
Click on Start export to initiate exporting. The generated file has the same name as the currently opened one, but with a new index.
| |
|
|