|
|
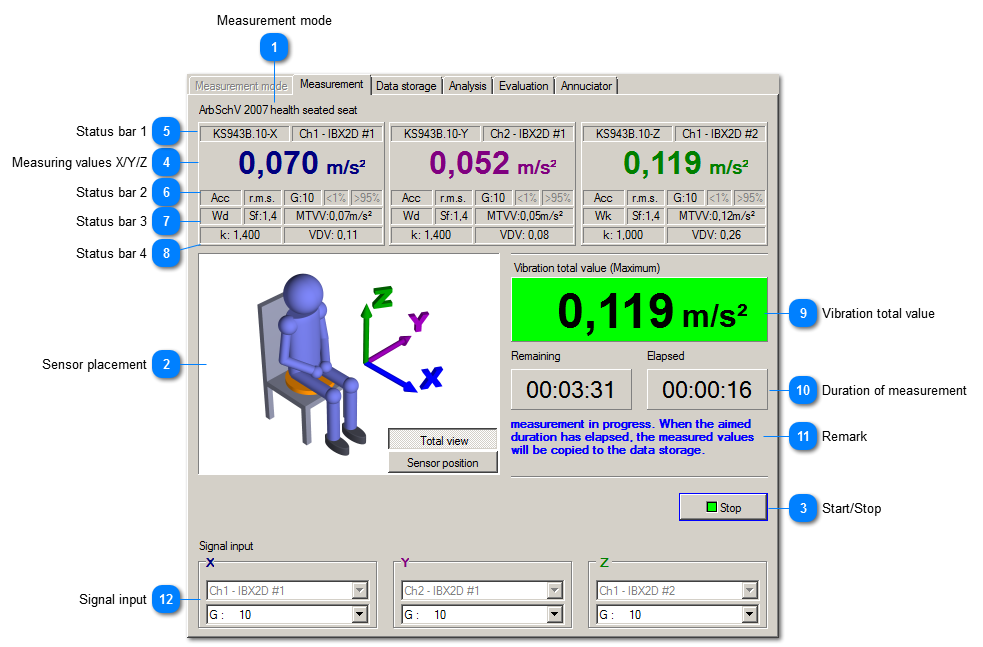
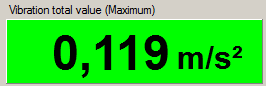
While measuring, VM-BODY displays the vibration total value and a colored assessment.
 Measurement mode
 Shows the selected mode.
| |
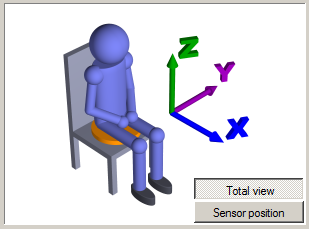
 Sensor placement
|
|
The image shows the body's coordinate system and the position of the sensor with regard to the person.
|
| |
 Start/Stop
 Starts and stops measurement. Starting is only possible when all settings in Measurement mode menu have been completed.
| |
 Measuring values X/Y/Z
This field displays the vibration value (weighted RMS value) for the measurement axes.
| |
 Status bar 1
| |
 Status bar 2
This status bar indicates:
| |
 Status bar 3
This status bar displays weighting filters, crest factor and MTVV.
Crest factor and MTVV are two additional characteristics which always have to measured when measuring human whole-body vibration conforming to the standard. For instance, they indicate whether the measurement contained shocks. If they exceed a certain value, this information has to occur in the measurement report. VM-BODY automatically monitors these characteristics in the background. In case of exceedance, the respective characteristic field is displayed yellow. VM-BODY is also able to take over limit exceedance to the measurement report automatically. | |
 Status bar 4
This status bar displays k factor and VDV.
The Vibration Dose Value (VDV) is common especially in Great Britain and is classified as vibration characteristic for whole-body vibrations there. It is formed automatically in VM-BODY.
| |
 Vibration total value
This can be, depending on the measuring mode, the vector sum or the maximum value of the 3 axis values.
| |
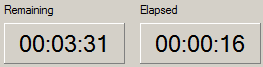
 Duration of measurement
Remaining and elapsed measurement duration are displayed. The elapsed measurement duration counts with minus sign from start delay to 00:00:00. Afterwards, the elapsed measurement duration counts up to the aimed measuring time. The measurement is stopped when it reaches the aimed measuring time. | |
 Remark
This remarks inform about the current state.
| |
 Signal input
At the signal input, you select the measuring channel and configure the measuring range. If you activated the sensor automatic, VM-BODY selects the measuring channel automatically. | |
|
|