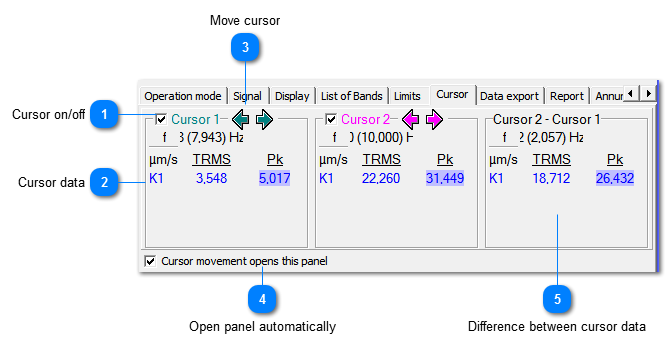
Two cursors are available. They can be moved along the frequency axis and indicate the measuring data at their position.
 Cursor on/off |
|
 Cursor data
|
|
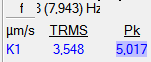
Shows the frequency position of the cursor and its amplitudes
|
|
|
 Move cursor
|
|
The cursor is shifted by the mouse.
|
|
|
 Open panel automaticallyIf selected, the cursor panel will open if the cursor is moved.
|
|
 Difference between cursor data
|
|
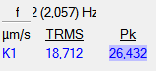
Shows frequency and amplitude differences if both cursors are enabled.
|
|
|