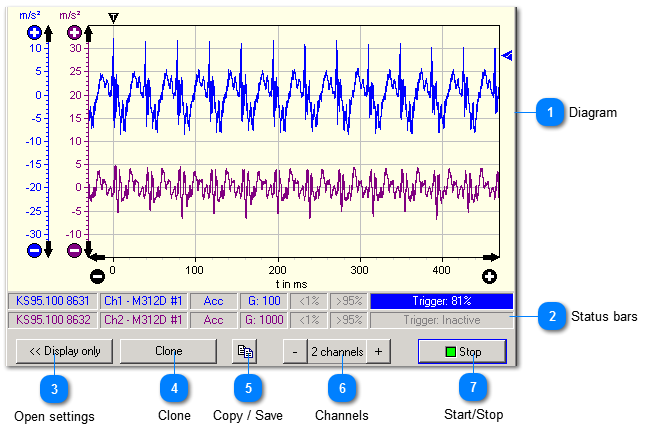
This section shows the most important status and signal data.
 Diagram
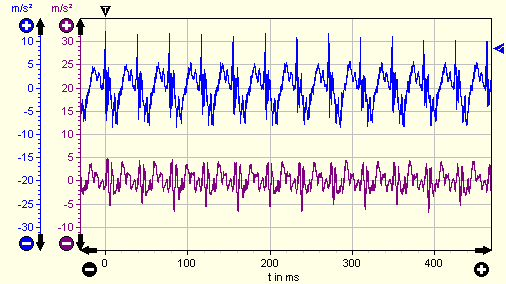
In the oscilloscope mode the diagram shows the vibration signal versus time. There is one trace per channel. Each one has its y axis which can be independently scaled and shifted.
Scaling is done with the buttons  and  . Click the arrows to shift the axis. The time axis can be scaled and shifted directly by the mouse pointer. Hold the left mouse button to shift and the right button to zoom.
|
|
 Status bars
The status bars show the most important channel settings:
|
|
 Open settings
Opens and closes the setup menu.
|
|
 Clone
Opens a new window with the same settings which can be modified.
|
|
 Copy / Save
|
|
Copies the diagram data into the clipboard or saves it on hard disk. Different file formats can be chosen.
| |
|
 Channels
Increase or decrease the number of measuring channels (and curves). One to four channels are possible.
|
|
 Start/Stop
 Starts and stops measurement. |
|