|
|
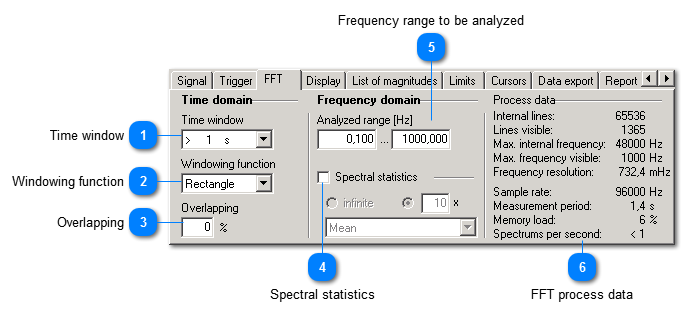
You can configure FFT parameters manually in all FFT modes except the automatic mode. The FFT control panel is composed of three areas:
-
Signal configuration in time domain (previous to FFT) -
Signal configuration in frequency domain (after FFT) -
Process data (shows how the analysis is working internally)
 Time window
The signal in time domain is divided into fixed time segments. Such a segment is transformed into the frequency range. The longer the time segment, the finer the resolution in frequency domain. VM-FFT always uses real measurement data and does not artificially extend with zeros (Zero pad).
| |
 Windowing function
An FFT is exact for discrete frequencies only. Usually, the frequencies in the measurement signal do not correspond to these discrete frequencies. As a result, there is so called leakage. To extenuate this effect, windowing functions are used. Common windowing functions are:
|
Rectangle
|
For analyzing shocks
|
|
Hann
|
For analyzing frequencies
|
|
Flattop
|
For analyzing magnitudes
|
Note: The windowing function "Hann" is also known as "Hanning". Actually it has been named after the mathematician Julius von Hann, so that "Hann" is the correct name.
| |
 Overlapping
The FFT can take over the different time segments successively without interruption or with an overlap. The percentage Overlapping indicates how much two successive time segments overlap. The more the time segments overlap, the more FFTs are generated in the same time - without a decrease in frequency resolution. Thus it is easier to monitor dynamic processes, for instance the start of an engine.
| |
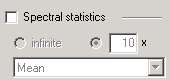
 Spectral statistics
Several frequency analyses can be combined mathematically, which makes it easier, for instance, to distinguish stationary from random vibrations.
Statistics can be either carried out infinitely for the whole switch-on time or for an adjustable number of analyses. In the statistics, the frequency values of several analyses are combined. Three methods are available:
|
Mean
|
The magnitudes are averaged arithmetically.
|
|
Square mean
|
The magnitudes are RMS averaged.
|
|
Maximum
|
Maximum values are formed.
|
For certain statistical methods, names have been established. For instance, the permanent forming of maximum values corresponds to the function peak hold.
| |
 Frequency range to be analyzed
|
|
You can enter a frequency range for the analysis. The measurement chart will only show values from within this range. The FFT can be carried out with a lower CPU load when entering a lower frequency range. Furthermore, the frequency range is used as a parameter for the bandpass filter of analog trigger sources. | | |
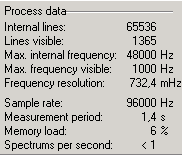
 FFT process data
|
|
In this area, you can read of internal parameters of the FFT which result from the selected settings. This process data is for information only.
| | |
|
|